Automate Custom Charts using Google Sheets
Form owners frequently ask for ways to automate custom charts and graphs for reports. Formsite provides several analytics charts and graphs for built-in reporting and analysis. These charts allow owners to see how individual questions perform, as well as:
- Percentage of each answer
- Subsets of answers using Results Filters
- Drop-off rate (where visitors abandon the form)
- Cross-tabulation (compare 2 different items)
- Inventory reports
For those not included in the built-in analytics pages, the best option to automate custom charts comes from Google Sheets. Using the integration to send new submissions to Google Sheets can also automatically update any charts.
Google Sheets Integration
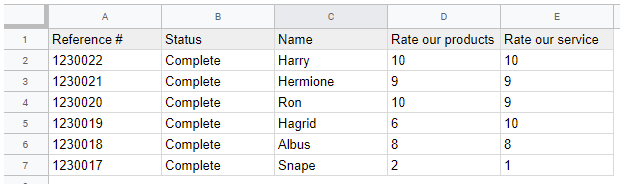
The Google Sheets integration allows form builders to send a copy of all results to a specific spreadsheet file. Enabling the integration sends every new successful result to the Google sheet as a new row.
Once the integration is set up, the sheet owner can reference the results data to display custom calculations, formats, and charts.
Automate Custom Charts
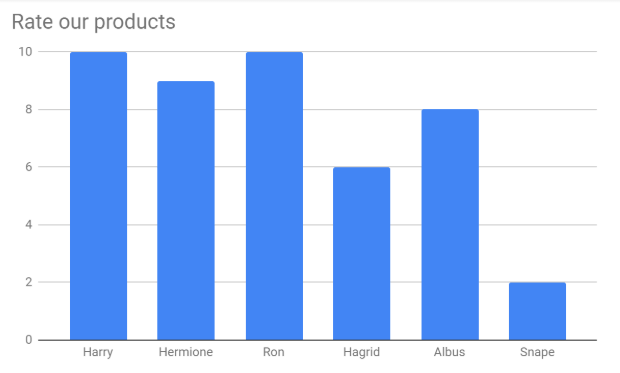
Creating a new chart happens from the Insert > Chart function. Select the type of chart and the data range, then style the chart as needed. Since the source data comes from the table updated by the form integration, the chart updates in real time.
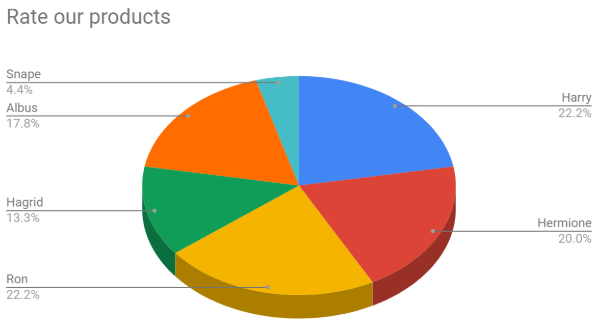
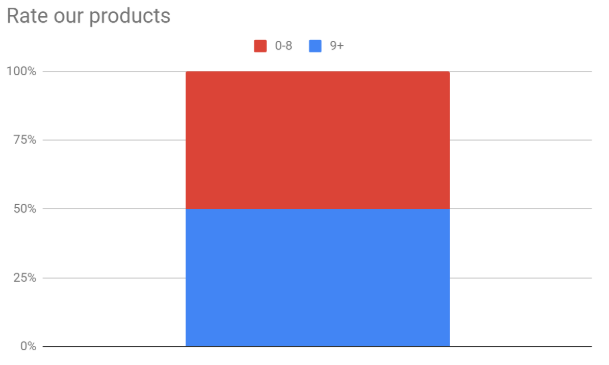
Using the range C1:D7 shows the ratings submitted by the form visitors. Selecting that range and choosing different charts shows the data in different formats. Choose the format that most clearly shows what you want to report.
Advanced Calculations
Sheet owners can perform advanced calculations by adding new columns or sheet tabs and including functions. Functions start with an equal sign (=) and follow with the name of the function and any variables. See Google’s list of functions at https://support.google.com/docs/table/25273.
Examples:
Show the average score
Add the AVERAGE function in a column to the right of the existing results table, followed by a remainder function for the rest of the value:
=AVERAGE(D2:D)/10
=1-K22
The column D contains the scores and the code D2:D selects the entire column starting with cell D2 (to skip the label). The “/10” means to divide by the largest value of 10. If the scale goes to 100, divide by 100 instead.
The “1-K22” displays the difference between the average score and 1, or 100%. The first function is in K22 and this function displays the difference between 100% and the result of the first function.
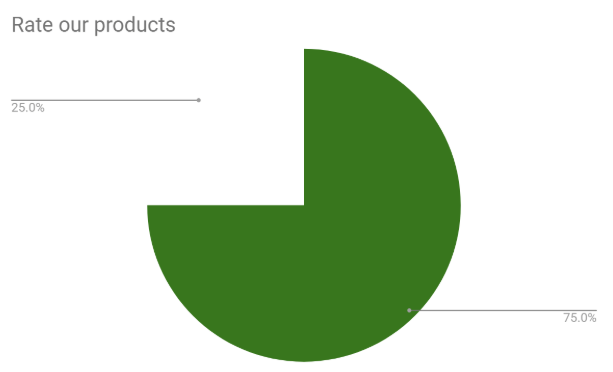
Display the percentage of results answered 9 or 10
Add this function to a column to the right of the existing table, followed by a remainder function:
=COUNTIF(D2:D,"<8")
=COUNT(D2:D)-K22
This function says to count the number of cells greater than 8 in column D. The following function subtracts that number from the total number of cells.